Characteristics of Oil and Gas
Retrograde Condensate Gas
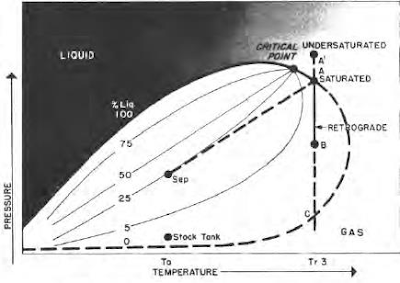
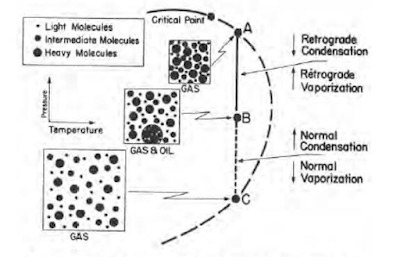
Some hydrocarbon mixtures exist naturally above their critical temperature as gas condensates. When pressure is decreased on these mixtures, instead of expanding (if a gas) or vaporizing (if a liquid) as might be expected, they tend to condense. Conversely, when pressure is increased, they vaporize instead of condensing. The process is illustrated by temperature condition Tr3 in Fig. 41, and the gas condensate curve in the next figure. This process is caused by forces acting on molecules of unlike sizes and depends upon a balance of these forces, as illustrated in the figure.
 |
| Phase diagram of retrograde condensate gas |
Normal vaporization and condensation, on the other hand, depend more upon balance between molecular forces of like-size component molecules.
As pressure drops (at constant temperature) below dew-point pressure (A), the attraction between light and heavy component molecules decreases because the light molecules move farther apart.
As this occurs, attraction between the heavy component molecules becomes more effective; thus, these heavy molecules coalesce into a liquid. This process continues until a pressure (B) is reached where a maximum amount of liquid is formed. Further reduction in pressure permits the heavy molecules to commence normal vaporization, the process whereby fewer gas molecules strike the liquid surface; this causes more molecules to leave than to enter the liquid phase, until complete vaporization of the liquid occurs again (C).
Wet Gas
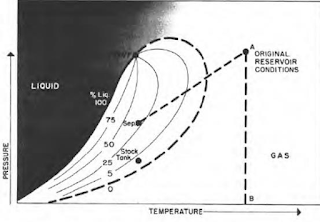
Behavior of a wet gas is shown in the next figure, where temperature is above the critical condensing temperature of the gas mixture. Therefore, a reduction of pressure (from A to B) will not cause liquid condensation. Passage of gas from existing temperature to stock tank conditions where the temperature is lower, however, will result in the formation of liquid. This is caused by a sufficient decrease in the kinetic energy of heavy molecules with temperature drop and their subsequent change to liquid through the attractive forces between molecules.
 |
| Phase diagram of wet gas. |
Dry Gas
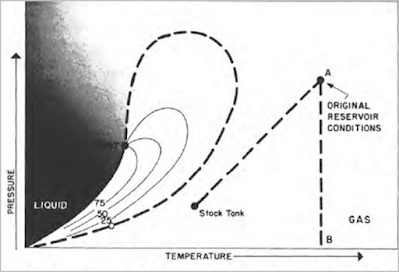
Behavior of a dry gas is illustrated by the phase loop in the next figure. The temperature is above the critical condensing temperature of the gas mixture and, like the wet gas, will not condense to a liquid with pressure drop (from A to B). Passage of dry gas to surface conditions will not, however, result in a condensation of liquid through lack of sufficient heavy material in the mixture. Kinetic energy of the mixture is so high and attraction between molecules so small that none of them coalesce to a liquid at stock tank conditions of temperature and pressure.
 |
| Phase diagram of dry gas |

