Wettability of Rocks
Wettability of reservoir rock
Wettability is defined as the tendency of one fluid to spread on or adhere to a solid surface in the presence of other immiscible fluids. The concept of wettability is illustrated in Figure 8.1.
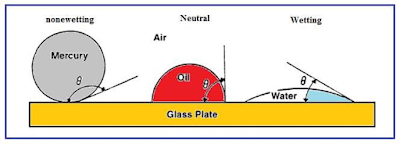 |
Figure 8.1
illustration of wettability |
- If a drop of water is allowed to fall on a clean plate of glass, the water spreads. The water is wet.
- If a droplet of mercury is allowed to fall on a clean plate of glass, the mercury remains in spherical form.
- If a drop of oil is placed on a clean glass plate, the oil droplet develops an approximately hemispherical shape.
When the rock is water-wet, there is a tendency for water to occupy the small pores and to contact the majority of the rock surface. Figure 8.1 In an oil-wet system, the location of the two fluids is reversed, and oil will occupy the small pores and contact the majority of the rock surface.
Depending on the specific interaction of rock, oil, and brine, the wettability of a system can ranges from water-wet, to intermediate wettability, mixed wettability, or oil-wet.
Intermediate wettability means that the rock has no overall preference for either oil or water.
The term "mixed wet" refers to areas of the interconnected pore space that are water-wet while the remaining surfaces are oil-wet.
In reservoirs, it is estimated that, in most situations, the wetting fluid is water (water/oil and water/gas pairs). However, in some cases, the oil may wet the limestones preferentially to the water, especially if there are a lot of limestones.
These mechanisms correspond to molecular attraction and repulsion between the fluids and solids present. Figure below shows the oil distribution (non-wetting fluid) in the pores of a rock filled with water (wetting fluid).
- water/ oil water is often the wetting fluid.
- water/ gas water is wetting fluid.
- oil/ gas oil is the wetting fluid.
The wettability of a reservoir depends on the following factors:
- Oil composition.
- Rock mineralogy.
- The PH of the formation brine
- pressure and temperature.
- thickness of the connate water layer.
The wettability of an originally water-wet rock surface can be altered by the adsorption of polar compounds and/or the deposition of organic matter that was originally in the crude oil.
An oil-wet condition is believed to be due to the presence of polar impurities or surface-active materials in the oil, which, over geologic time, have been adsorbed by the rock thereby increasing its surface affinity for oil and rendering it oil wet.
Calculation of wettability
A number of methods are used to asses wettability in the laboratory. These include:
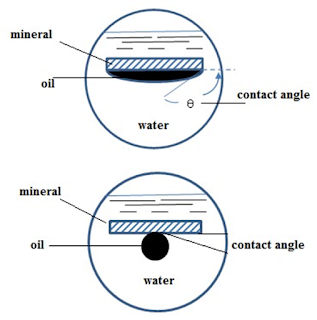
- Measurements of contact angles on flat, polished mineral crystals.
- Measurement of the rate of water and oil imbibitions into core plugs.
Measuring the angle of contact at the liquid-solid surface
The contact angle ϴ has achieved significance as a measure of wettability. As shown in Figure, as the contact angle decreases, the wetting characteristics of the liquid increase.
- A contact angle of zero would indicate complete wetting by the denser phase.
- An angle of 90o indicates that neither phase preferentially wets the solid (neutral wettability).
- An angle of 180 indicates complete wetting by the less dense phase.
II- Sessile drop ratio
Another convenient index of wettability is the sessile drop ratio, defined as the ratio of the height of a droplet on a surface to the breadth of the droplet.
- A sessile drop ratio of 1 indicates complete nonwetting.
- A ratio of zero indicates complete wetting.
Indirect measurement:
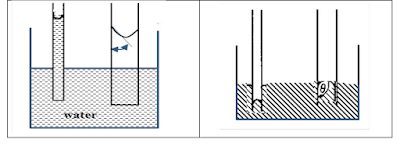
It is proposed that the contact angle and some degree of wettability of a porous system can be calculated from the threshold pressure (pressure just causing nonwetting fluid entry). In Figure 8.5, the capillary rise of water in a tube and the capillary depression of mercury are shown. A wetting fluid tends to enter a pore or tube spontaneously, while a nonwetting fluid resists entry.
Apparent contact angle is defined by eq.
Fluid distribution multiphase system
The wettability of reservoir rocks to the fluids is important in that the distribution of the fluids in the porous media is a function of wettability.
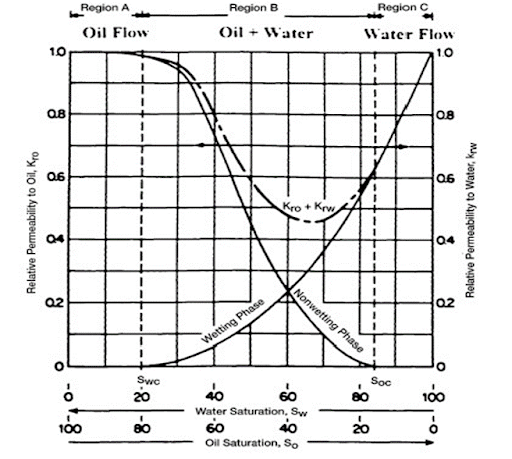
The distribution of the wetting and non-wetting phases is commonly classified as;
• Pendular
• Funicular
• Insular
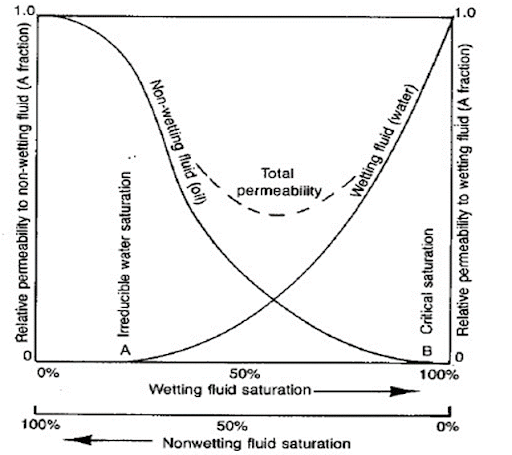
Depending on their levels of saturation in region A, Figure 8.6 the aqueous phase exists mainly as pendular rings around the grain junctions, which may only contact each other via an extremely thin adsorbed layer on the rock surface. In region B, both phases exist in continuous flow paths through their own pore networks, and both are said to be in funicular saturation. As water saturation continues to increase, oil saturation is finally reduced to the point where the connecting threads break and oil becomes discontinuous at the value Sor. Thus, in region C the oil exists in small, isolated groups of pores (islands) or in a state of insular saturation.
Again, this discussion has considered water as the wetting phase and oil as non-wetting; however, the general concepts apply to any system of wetting and non-wetting fluids. Therefore, in summary:
|
Region |
Wetting phase saturation |
Non-wetting phase saturation |
|
A
|
Pendular
|
Funicular
|
|
B
|
Funicular
|
Funicular
|
|
C |
funicular
|
Insular
|
What is the practical significance of this behavior?
- The presence of oil in a rock is not proof that oil will be produced.
- predictions of the future producing behavior of entire fields are based on the calculation of future production rates at steadily decreasing oil saturations, these predictions require that this curve be known.







Comments